Fighter Cut › Articles › Weight cut & fight week
Weight cut & fight week
Reading a bodyweight trend in camp: signal and noise
A daily scale reading is mostly noise, and the published variability figures let you size exactly how much. What that arithmetic cannot do is tell you whether a cut is safe — nobody has measured that.
A fighter steps on the scale on a Tuesday in week three and it reads four hundred grams heavier than Monday. Something happens next, and it is almost always the wrong thing. The evening meal shrinks. A session gets added. A coach gets a text at eleven at night.
Here is the problem with that Tuesday. On the published measurements of how much body mass moves around on its own, four hundred grams is smaller than the ordinary day-to-day spread in people who were not dieting, not training twice a day, and not manipulating carbohydrate or fluid at all. The reading is real. What it means is another question entirely, and for a single day the honest answer is: almost nothing.
This article is about the gap between those two things. It sizes the noise using the two best measured figures available, works out how long a series has to run before a real camp trend can be seen through that noise, and is explicit that the arithmetic doing the work is this article's own reasoning rather than a published method. It is not a weight-cut plan. It contains no volumes, no schedules and no durations, and the place where it stops is a physician, a commission and a coach standing in the room.
Standard deviation of the day-to-day relative change in body mass, rising to 0.69% at a seven-day interval — measured over 9,521 standardised days in one healthy, weight-stable man, not an athlete and not in a deficit
Schneditz et al., Ren Fail 2023;45(2):2273421
Variability of first-morning body mass over three days in 22 elite male field hockey players at a training camp, with no improvement from measuring for six or eight days instead
Vescovi & Watson, Int J Sport Nutr Exerc Metab 2019;29(1):46–50
The camp descent rate the 2025 ISSN position stand describes for combat athletes, contingent on camp length and how much mass has to come off — narrative recommendation, professional MMA framing, no evidence grade attached
Ricci et al., J Int Soc Sports Nutr 2025;22(1):2467909
No published work smooths an athlete's bodyweight series to detect a camp trend. Every result we found for the method was a blog or an app vendor page carrying no data. The arithmetic below is therefore ours, and labelled as such
Our own literature search, September 2026 — see "What we could not verify"
- The best-measured day-to-day noise figure is a standard deviation of 0.53% of body mass at a one-day interval — about 320 g on a 60 kg athlete — and it was measured in a healthy, weight-stable, non-athlete man over 9,521 standardised days. A fighter in a deficit, training hard, will see more than that, not less.
- A camp descent at the position stand's 0.5–1 kg per week works out to roughly 70–140 g of real change per day. That is a fraction of the day-to-day spread. A single day's reading cannot answer the question it is being asked.
- The obvious fix — average a week of readings and divide the noise by the square root of seven — overstates what averaging buys by about threefold, because the measured variability grows with the interval (0.53% at one day to 0.69% at seven). Growth like that is a drifting baseline, and averaging does not remove drift.
- Correcting for that, the honest floor on comparing one week's average to the next is roughly the measured seven-day figure, about 0.4 kg on a 60 kg athlete — against a weekly signal of 0.5–1 kg. Readable, but marginal. Two weeks is the first interval that is comfortably readable.
- Things that move the scale by more than a full week of real loss include a hard session (post-match body mass fell by more than 1% in 50–85% of players in one camp, and by more than 2% in up to 40%), and the glycogen-and-gut compartment the position stand associates with a 1–2% shift during fight week.
- A week in which the scale went up is inside the ordinary range of all of those. That is a statement about measurement. It is not permission to make up the difference acutely.
- Every acute figure in this literature carries a supervision clause inside the same sentence, and the position stand states outright that the long-term effects of frequent weight cuts on health and performance are unknown.
- The measured combat-sport data here is male. There is no coefficient that converts these numbers for a woman or for an adolescent, and the two menstrual-cycle studies available are non-combat athletes who disagree with each other about direction.
1. What the scale is actually measuring
A body mass reading is one number standing in for several independent compartments, and only one of them is the thing a camp is trying to change.
Fat mass moves slowly, on the order of grams per day. Lean tissue moves slowly too, and mostly in the wrong direction under a deficit. The compartments that move fast are water and gut contents, and both of them move by amounts that dwarf a day of real change.
Water is not a passenger here; it is structurally tied to fuel. The best measurement of that tie comes from muscle biopsy work by Fernández-Elías and colleagues, who dehydrated nine aerobically trained subjects by 4.6 ± 0.2% of body mass with 150 minutes of cycling at 65% of VO₂max in 33 ± 4 °C, then took biopsies before rehydration and at one and four hours after it. Under limited rehydration, they reported that "per each gram of glycogen, 3 g of water was stored in muscle (recovery ratio 1:3)". Under full fluid replacement matched to losses, the same paper measured a ratio of 1:17 — which the authors read as water stored in muscle that was not bound to glycogen at all.
Two conditions on that number, because it is the one most often stripped of them. It is a recovery ratio measured under insufficient rehydration in nine trained subjects whose sex the abstract does not state, and the same experiment produced a wildly different ratio when fluid was fully replaced. The 2025 ISSN position stand restates the relationship narratively as "1 g glycogen to 2.7 g water", which is a synthesis rather than a new measurement; when this article needs the ratio it is the biopsy figure that carries the weight.
The direction is what matters for reading a trend. Whatever the exact coefficient, a few hundred grams of glycogen swing carries a multiple of its own mass in water with it — and glycogen swings by a few hundred grams routinely, from a hard session, from a rest day, from a change in carbohydrate intake nobody wrote down.
Gut contents are the second fast compartment. Reviews of Olympic combat sports name them explicitly: increased exercise and restricted food and fluid intake are described as reducing body water and gut contents to reduce body mass. We could not locate an isolated measured mass figure for gut contents in this research pass. What exists is the position stand's combined figure for the fight-week manipulation of glycogen and low-fibre intake together — 1% to 2% of body mass. This article reports that a compartment exists and that the scale reads it. It does not report how it is emptied.
2. How big the noise is, measured twice
Two published figures come closest to answering "how much does body mass move on its own", and neither of them was measured in a fighter.
The first is the most patient dataset in this literature. Schneditz and colleagues analysed 9,521 days of standardised body mass measurements in a single healthy man and reported that "the average and median relative differences were zero, with a standard deviation (SD) of 0.53% for the one-day interval, increasing to 0.69% for the 7-day interval, and this variability was constant throughout the observation period." Their own practical gloss: "a body mass variability of approximately 0.6% (±450 mL in a 75-kg patient) should be taken into consideration" when setting weight-dependent treatment prescriptions.
Conditions, non-negotiable: n = 1. One healthy male, not an athlete, not in a deficit, not training, over more than twenty-five years of measurement. The value of the number is its enormous within-person sample, not its generalisability across people.
The second figure comes from athletes. Vescovi and Watson followed 22 elite male field hockey players through a ten-day pre-Olympic training camp and reported that "measurement of morning body mass and Usg for 3 days had low variability (CV < 1%) with no improvement at 6 or 8 days."
Conditions: 22 elite male field hockey players, first-morning measurement, a training camp with ample fluid availability, not making weight, no women in the cohort. But note the second half of that sentence, because it is the practically useful part: three days of morning measurement was as informative as eight. The information saturates fast.
The same study is worth reading for two further results that bear directly on how a fighter should interpret a Tuesday. Post-match body mass was reduced by more than 1% in 50–85% of players, with up to 40% experiencing changes greater than −2%. And post-match changes in body mass were unrelated to urine specific gravity the following morning. On top of that, between 36% and 73% of players were classified as euhydrated on morning urine specific gravity across camp days — meaning the morning baseline itself was not a fixed hydration state, even in athletes with unrestricted access to fluid.
Neither of these cohorts had a weigh-in. These are measurement-variability figures from people with no competition on the calendar, which is exactly why they are usable as a noise floor and exactly why they cannot be read as anything about a cut.
3. Why those figures are a floor, not a ceiling
The instinct is to treat 0.53% and "CV under 1%" as the range a fighter should expect. That reading is backwards.
Both cohorts were weight-stable and not cutting. One was a healthy non-athlete living an ordinary life; the other was elite male field hockey players eating and drinking freely at a training camp. Every mechanism that adds variance to a body mass series was either absent or dialled down in both.
A fighter in week three of camp has all of them switched on at once. Carbohydrate intake is moving, so glycogen and its bound water are moving. Training load is higher and more variable, and the field hockey data shows what one hard session does to the scale. Fluid intake is being watched, which usually means it is being changed. Fibre and food volume are shifting, so gut contents are shifting. Sleep is worse, which changes when the athlete last ate.
So the correct statement is: 0.4 to 0.8 kg on a 60–80 kg athlete is the floor on day-to-day noise, measured in people doing none of the things a fighter is doing. Anyone reading their own series should expect the real number to be larger. What they should not do is round folklore up to fill the gap — the "everyone fluctuates five pounds" figure that circulates in gyms has no measurement behind it in anything we found, and inventing a bigger number to feel better about a bad week is the same error as inventing a smaller one.
Both cohorts behind this floor were also male, and a female athlete's series carries one more source of recurring, non-random variation on top of it: a roughly monthly fluctuation tied to the menstrual cycle, covered in menstrual cycle and weight cutting, which is measured, real, and still smaller than most gym folklore about it claims.
4. The article's own arithmetic: signal against noise
No published study smooths an athlete's bodyweight series to detect a camp trend. The arithmetic in this section is this article's own, laid over two published variability figures, and it is presented as reasoning rather than as a finding. Nothing below is a result anyone has measured.
Take a 60 kg athlete, roughly the scale of a flyweight in camp, and take the position stand's descent rate: "combat athletes are commonly recommended to aim for weight loss of 0.5–1 kg of body mass each week", described as contingent upon the length of the camp and how much body mass must be lost. It is a narrative recommendation in a position stand with no evidence grade attached to it, framed around professional MMA.
The signal. At the midpoint of that range — 0.75 kg per week — the true daily change is about 107 g.
The noise on one day. The Schneditz figure of 0.53% for the one-day interval is the standard deviation of the change between two consecutive days, which is exactly the comparison a fighter makes when they look at yesterday's number. On 60 kg that is about 320 g.
The comparison. 107 g of real change hiding inside a spread whose standard deviation is 320 g. The signal is roughly one third of one standard deviation of the noise it is sitting in. That is not a hard call to make; it is a call that cannot be made at all. The day-to-day comparison a fighter performs every morning is, on the best available numbers, uninformative about the thing it is being used to judge.
And if the day-to-day figure came from a healthy non-athlete and the athlete cohort's morning CV was closer to 1% — 600 g on the same 60 kg — then the situation is worse, not better.
The immediate consequence is a change in what the daily reading is for. It is a data point in a series. It is not a verdict, it is not feedback on yesterday's dinner, and treating it as either converts a measurement system into an anxiety machine.
5. Where the square root of seven goes wrong
The obvious next move is averaging. If a single reading has a standard deviation of σ, the mean of seven readings has a standard error of σ/√7 — about 38% of the original. Do that on both weeks and the difference between two weekly averages carries a standard error of roughly σ × √2/√7. On a 60 kg athlete with σ around 360 g, that lands near 190 g, against a weekly signal of 750 g. Signal-to-noise of about four. Problem solved, apparently.
It is not solved, and the same paper that supplied the noise figure says why.
Schneditz measured the variability rising with the interval: 0.53% at one day, 0.69% at seven. If the day-to-day scatter were independent random noise around a slowly moving true value, the standard deviation of the change would be roughly the same at every interval. It is not. It grows. Growth like that is the signature of a drifting baseline — a component of the variability that persists from day to day rather than resetting.
Averaging removes the independent part. It does not remove drift. A seven-day mean of seven readings that all share the same drift is not seven independent measurements of the truth; it is closer to one measurement with some of the jitter smoothed off.
So the honest floor on comparing two points a week apart is not the √7 number. It is the measured seven-day figure: 0.69% of body mass, about 410 g on a 60 kg athlete.
That is the correction that matters most on this page. The naive arithmetic promised about 190 g of precision on a week-to-week comparison. The measured interval data says the floor is around 410 g — roughly three times larger. Every conclusion drawn from the optimistic version is over-confident by that factor.
Recompute with the floor in place:
- One week against the next. Signal 0.5–1 kg; noise floor around 0.41 kg. Signal-to-noise between roughly 1.2 and 2.4. A week-to-week comparison is readable, but it is close enough to the noise that a single bad week is a perfectly ordinary outcome of a camp that is on schedule.
- Two weeks apart. The signal doubles to 1.0–2.0 kg. The drift term grows, but on the measured data it grew slowly — from 0.53% to 0.69% across a sevenfold increase in interval — so it does not double with the signal. Signal-to-noise lands somewhere near 2.5 to 4. This is the first comparison that is comfortably readable.
- Four weeks apart. Comfortably readable on any reading of the noise, which is why the four-week view is the one worth arguing about with a coach.
Two caveats, both of which limit this arithmetic rather than support it. Schneditz measured intervals out to seven days; extending the drift behaviour beyond that is an assumption of ours, not a measurement. And the whole calculation assumes the noise is symmetric and centred on zero, which it was in that dataset — mean and median relative difference were both zero — but which nobody has verified in an athlete under a deficit.
6. The things that moved the scale instead
For the same 60 kg athlete, each of the following is larger than a full week of real loss at the midpoint rate:
A hard session. In the field hockey camp, post-match body mass was reduced by more than 1% in 50–85% of players, and by more than 2% in up to 40% — 0.6 kg to 1.2 kg and beyond on a 60 kg athlete. And it was unrelated to next-morning urine specific gravity, which means the athlete cannot look up the following day and tell whether the scale is showing them a rehydration deficit or not.
Glycogen and the gut. The position stand associates a 1% to 2% body mass loss with fight-week depletion of water-bound glycogen stores through exercise and carbohydrate restriction — 0.6 to 1.2 kg on a 60 kg athlete — and describes equivalent losses from a low-fibre intake. This article reports the size of the compartment. It does not print the manipulation that empties it, the doses, or the durations, because that is a protocol and this is not.
Fluid handling on its own. A supervised six-day laboratory trial in 21 male combat-sport athletes on an energy-matched standardised diet found that fluid manipulation before a period of fluid restriction produced a between-group difference in body mass loss of 0.6% of body mass (p = .02, effect size 0.82) and a 39% difference in the fluid input/output ratio (p < .01, effect size 1.2). On a 60 kg athlete, 0.6% is about 0.36 kg — moved by fluid handling alone, in a laboratory, with nothing happening to tissue. No women were in that cohort. The volumes and the schedule are deliberately not reproduced here.
Line those up next to a week of real loss at 0.5–1 kg and the conclusion is unavoidable. A week in which the scale went up is inside the ordinary range of a hard session, a carbohydrate swing, or gut contents, individually. That is a statement about measurement. It is not permission to make up the difference acutely, and the counterweight to that reading is in section 11.
7. A worked example: two weeks of a noisy series
Mara Delgado is invented for this article. She is not a client, not a case study and not a composite of one — Fighter Cut has no coached roster, and the only individual-level accounts in this piece are the published, ethics-approved ones. She exists so the arithmetic above has something to sit on.
Mara is a flyweight, four weeks out from a bout at 56.7 kg. She started camp at 64.0 kg — 12.9% above her division, which sits just inside the 12% to 15% band the position stand describes for the off-camp and general-preparation phase in professional MMA. She is now 59.6 kg. That is 4.4 kg gone, with 2.9 kg between her and the division, and she has four weeks in which to move it — about 0.72 kg per week, inside the stand's range.
Her two-week series is ugly. There are three consecutive mornings where the number goes up. There is a Thursday-to-Friday jump of half a kilogram after her hardest sparring day of the week. There is a flat five-day stretch in the middle where nothing appears to happen at all.
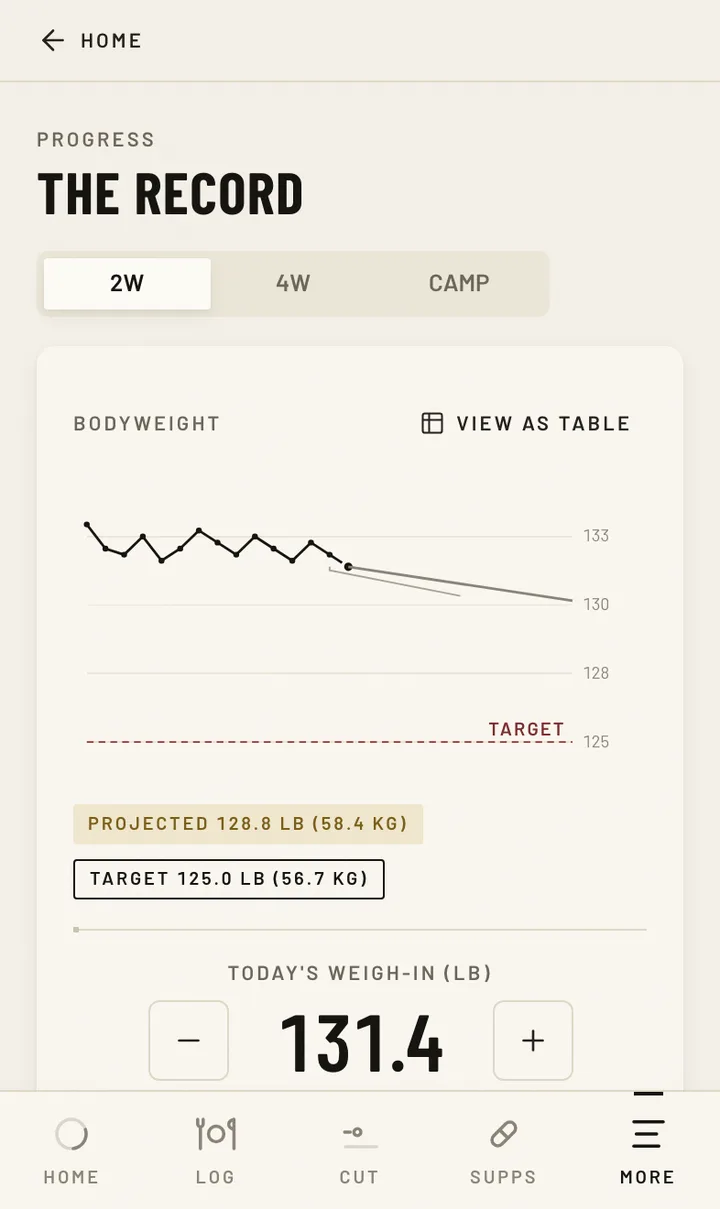
Every one of those features is predicted by the arithmetic in section 5. On a 60 kg athlete the day-to-day noise has a standard deviation near 320 g, so a run of three rising mornings is unremarkable — with a true daily change of about 100 g against that spread, consecutive rises are common. The half-kilogram jump after sparring sits precisely in the range the field hockey data reports for a hard session. The flat five days are what a 500 g real change looks like when it is buried under a spread of similar size.
What the two-week view can support is a comparison of its two halves — and the honest precision on that comparison is around 410 g, not 190 g. Her weekly signal is 720 g. The comparison is readable, and it is close. A single week showing 300 g instead of 720 g is not evidence that the camp has stalled. It is inside the floor.
8. The four-week view, and what changes
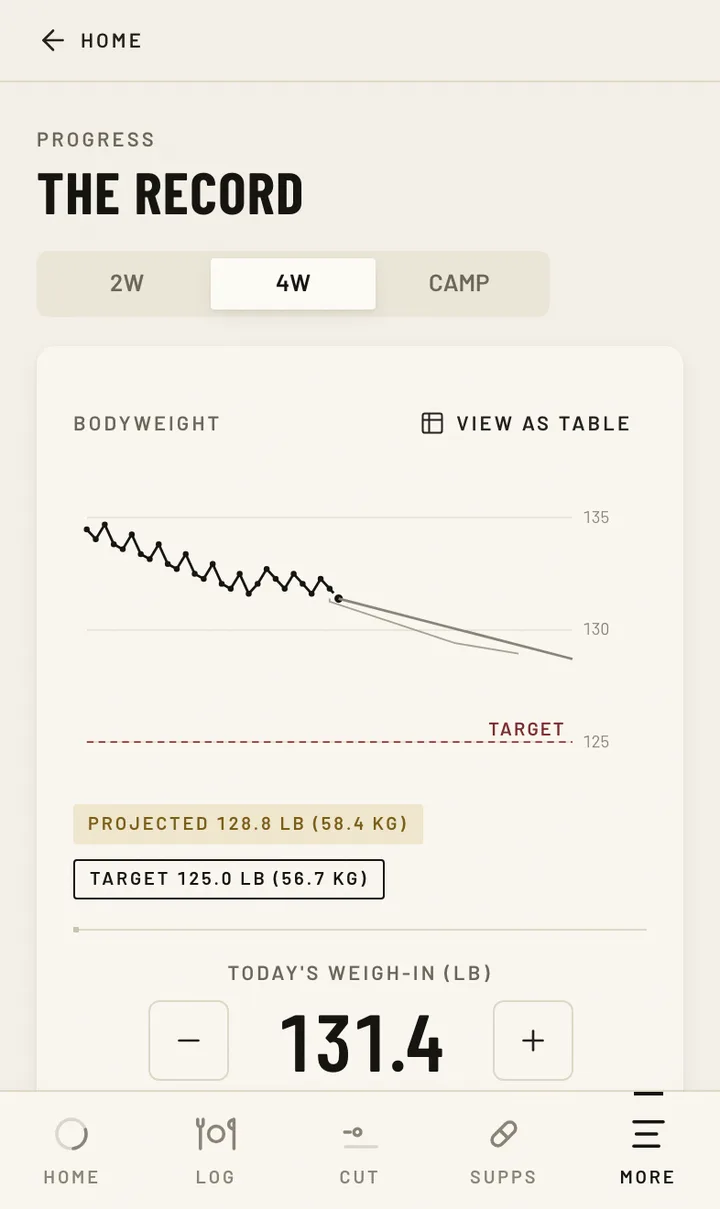
Nothing about the individual readings changes when the window widens. The scatter is identical. What changes is the ratio between the total real movement and the noise it is sitting in: 4.4 kg of descent against a noise floor still measured in hundreds of grams.
This is the whole argument in one image. The daily number is not a bad measurement — it is a fine measurement of a quantity that includes several things nobody is trying to change. It is the window that makes it interpretable, and the window has to be long enough for the real change to exceed the drift.
The practical shape of that: a decision about whether a camp is on track is a two-to-four-week decision. A one-week decision is defensible if it is a small adjustment, made in the knowledge that the evidence supporting it is thin. A one-day decision is not defensible at all, because on the published variability figures there is nothing there to decide with.
None of that is a licence to skip the daily reading. The daily reading is what makes the two-week and four-week windows possible, and three days of standardised morning measurement was as informative as eight in the one athlete camp that tested it. Weigh often; conclude rarely. That distinction is most of what fight camp planning buys.
9. The measurement conditions the figures were earned under
The "CV under 1%" figure is not a property of a scale. It is a property of a standardised measurement, and the standardisation is doing most of the work.
In the field hockey camp, body mass was recorded on waking. That is the condition. Same time relative to waking, post-void, before food or fluid, same scale, same surface, same amount of clothing. Change any of those and the number acquires variance that has nothing to do with the athlete.
The size of what standardisation removes is easy to underestimate. A meal and its fluid is a direct addition to mass. The difference between weighing before and after training is, on the field hockey data, potentially more than 1% of body mass. Weighing in the evening instead of the morning imports an entire day of eating and drinking into a series that is trying to detect 100 g of daily change.
There is a second point in the field hockey result that deserves attention because it saves time: measuring for three days was as informative as measuring for six or eight. Beyond a short standardised run, the returns come from measuring for longer in calendar time, not from measuring more times per day. Weighing twice a day does not sharpen the trend; it adds a second, noisier series.
For anything more than mass, the same logic gets stricter, and the errors get larger relative to what is being detected — that is the subject of body composition tracking through a camp, where dehydration alone is enough to make a scan misreport water as lost lean tissue.
10. Fight week is a different measurement problem
Everything above concerns the longitudinal descent. Fight week is not that, and the trend-reading logic does not extend into it.
Before any percentage in this section: the weigh-in format decides what these figures describe. Reviews of Olympic combat sports record that official weigh-ins are conducted anywhere from 3 up to 24 hours before competition. The professional MMA cohort discussed below weighed in 8 days before competition — an unusually long recovery window. The professional boxing data below is from a day-before weigh-in format. Same-day weigh-ins, the norm in much amateur boxing, BJJ and Muay Thai, make every acute figure in this section inapplicable: at a same-day weigh-in, a figure measured under an eight-day window describes nothing.
With that in place, two cohorts show how large the fight-week movements are.
Maurício and colleagues followed 31 professional MMA athletes — 28 men and 3 women, mean age 28 ± 4, all with established prior rapid-weight-loss experience — through a nutritionist-supervised protocol with daily compliance checks. They reported "a mean weight reduction of 7.25 kg (10.6%) within the 7 days leading up to the weigh-in, conducted 8 days before competition" and "a mean weight regain of 7.5 kg (11.2%) within 30 h post-weigh-in". Reported symptoms in that cohort: fatigue 58%, cramps 32%, dizziness 22%, with no severe symptoms such as fainting or chest pain reported by any athlete. The three women are folded into means with twenty-eight men and never separated.
Murugappan and colleagues took a different route to the same territory: official commission scale data from California, 2015–2018. Of 399 male professional boxers, 389 (97.5%) gained weight between official weigh-in and competition, with total absolute gain of 4.4 ± 2.2 kg — 7.2 ± 3.5% of body mass. International-promotion boxers gained more than regional (8.0 ± 3.0% vs 6.6 ± 3.7%, p < 0.001), and 82 athletes (20.6%) gained 10% or more. These are measured scale readings taken by a commission, not survey recall.
The position stand also gives figures at fixed distances from a weigh-in: "suitable losses in body mass range from 6.7% at 72 h, 5.7% at 48 h, and 4.4% at 24 h, prior to weigh-in." The three graded figures are three answers to one question asked at three moments. They are not stages and they do not sum — any construction producing a cumulative figure near 17% is fabricated. And where acute water loss is described at all, the figure never travels alone; the position stand's sentence reads: "During fight week, acute water loss strategies, including sauna, hot water immersion, and mummy wraps, can be used effectively with appropriate supervision (optimally ~2–4% of body mass within 24 h of weigh-in)." The supervision clause is inside the figure's own sentence and this article will not separate them. What that literature does with those numbers is the subject of how much weight can you cut before a fight.
Why this matters for trend reading: the last week of a series is not measuring the same thing as the first three. During a longitudinal descent, the trend is trying to see slow tissue change under fast water noise. During fight week, the fast compartment is the intervention. Running a moving average through both and reading it as one line produces a number that describes neither.
11. What the trend cannot tell you
A tidy series is not evidence of a safe camp, and this is the point at which the arithmetic on this page has to be handed off.
In a published single-athlete case study, an elite male MMA athlete was monitored in a laboratory across an eight-week weight-making plan that reduced body mass by 18.1%, from 80.2 kg to 65.7 kg. The measured outcomes included a fall in resting metabolic rate of 331 kcal, testosterone below 3 nmol/L, cholesterol above 6 mmol/L, plasma sodium of 148 mmol/L — hypernatraemia — and serum creatinine of 177 µmol/L, which is acute kidney injury. This article does not reproduce the phases, the volumes or the durations of that plan. Publishing the method next to a fighter's reason to believe he would tolerate it better is precisely the harm worth avoiding, and the documented outcome does not defuse it.
The relevant point for trend reading is this: week by week, on a scale, that plan looked like a camp running on schedule. A body mass series is a measurement of one number. It has no channel for plasma sodium, creatinine, resting metabolic rate or hormones, and it did not warn anyone.
Which produces the governing statement for this whole article. There is no figure in this literature that is safe to attempt without supervision. Every acute number in it was measured on someone who had a physician, a nutritionist, a laboratory or a certifying institution standing next to them, and the position stand states outright that "the long-term effects of frequent weight cuts on health and performance are unknown, necessitating further research." The absence of an unsupervised figure is the finding, and this article does not fill it with judgement.
Two further refusals belong here. The Maurício paper reports that 67.7% of its athletes won their bouts; that cohort had no control group, no comparator win rate, and was self-selected from athletes with prior rapid-weight-loss experience. It establishes nothing causal and it is not evidence that a cut wins fights. And the same paper states that severe health events "including hospitalizations and even athlete fatalities" are documented in media and scientific literature — with no tally, no denominator and no date range. Fatalities associated with rapid weight loss are documented. No source counts them, there is no adverse-event registry for combat sports, and that absence is part of the problem. No number of deaths should ever be attached to that sentence.
Nothing on this page overrides a commission, a federation or a physician. Where a rule is jurisdiction-specific — and all of them are — it is the jurisdiction sanctioning the bout that decides.
12. Who these numbers were not measured on
The measured combat-sport data in this article is male.
Of the cohorts cited here, the biopsy study did not state sex, the variability studies are one man and 22 men, the water-loading trial is male combat athletes, the case study is one man, and the boxing commission dataset is 399 male professionals. The prospective MMA cohort contains three women among 31 athletes and does not disaggregate its results. Nine of the eleven cohorts have no women in them at all.
Two sources do address women in combat sport directly, and both come with heavy conditions. A survey of 169 Chinese national and international-level Sanda athletes — 96 men and 73 women, the largest female subsample available — found that 56% deliberately used weight-loss practices, with mean habitual weight loss of 7.6 ± 3.7% and mean highest-ever loss of 10.8 ± 4.2%. It also measured a sex difference in the other direction to the folklore: male athletes' habitual weight-loss percentage (p = 0.009), highest weight-loss percentage (p = 0.002), number of cuts in the past year (p = 0.048) and rapid weight loss score (p = 0.011) were all significantly higher than female athletes'. That is self-reported recall, not measured mass. Separately, a survey of 260 high-caliber Australian wrestling, boxing, judo and taekwondo competitors found that neither sport, sex, nor weight division affected rapid weight loss score — athlete caliber did (p = .00792).
On the menstrual cycle and body mass, the two available studies disagree, and the disagreement is the finding. One reported body mass higher during the mid-luteal phase than the mid-follicular in 30 recreationally active young women, with total body water and fat mass similar between phases, "large variability among the individual responses", and a recommendation to repeat body composition measurements in the same phase. The other, in 20 elite female soccer players monitored across two consecutive cycles, reported body mass increasing with total body water from the ovulatory to the early follicular phase. Peak in mid-luteal versus peak in early follicular — opposite directions, neither cohort a combat athlete, neither in a deficit, and neither reporting a magnitude in kilograms that anyone could plan around. This article prints no menstrual-cycle body mass figure because no defensible one exists in these sources.
Adolescents are worse served. One survey found sport differences in the age at which weight cutting began (p = .001); another found no significant junior/senior difference in habitual or highest weight loss. No day-to-day body mass variability data in adolescent combat athletes was located at all — and growth makes the trend question structurally different for them, because the baseline is genuinely moving.
The differences that matter here — body composition, total body water as a fraction of mass, cycle effects on fluid balance — are not adjustable with a coefficient. Where a governing body legislated for the difference, it did so with a separate rule and a different number rather than a multiplier: the NCAA implemented a minimum-weight programme in the wake of collegiate wrestling deaths in 1997, and the brief review describing it exists mainly to outline problems with the validity of the methods used to assess minimum weight.
And the reader most exposed is the one least studied. Every cohort here is professional, national-level, or elite. Nothing was found on amateur or club-level athletes, who have the least supervision and the most need for a trend they can read.
What we could not verify
- No published study smooths an athlete's bodyweight series to detect a camp trend. We searched for self-weighing, smoothing, moving averages and filtering applied to body mass in athletes. What came back was either obesity-intervention modelling — a weight-change prediction model from Thomas and colleagues (Journal of Biological Dynamics, 2011, PMID 24707319) with a mean absolute error of 1.8 ± 1.3 kg against measured values, which is not a noise-filtering method for athletes — or non-peer-reviewed app and blog content. Every top result for the method itself was a vendor page or a fitness blog carrying no data. This is the most important paragraph on the page: the signal-to-noise arithmetic in sections 4 and 5 is our own reasoning laid over two published variability figures, and anyone telling you a seven-day moving average is the validated method for a fight camp is not citing anything.
- No measured day-to-day body mass variability figure exists for combat athletes in camp. The two figures used here are one healthy non-athlete and 22 field hockey players who were not making weight. Both are the closest available and neither is the reader.
- No isolated measured mass figure for gut contents. Reviews name it as a compartment; the position stand bundles it with glycogen depletion in a single 1–2% figure. Nothing separates them.
- The drift behaviour beyond seven days. Schneditz measured intervals up to seven days. Our claim that the drift term grows slowly beyond that is an inference from the shape of the measured data, not a measurement.
- Evidence grades. The position stand attaches no A/B/C evidence-grade letters to the points quoted here. We do not imply one.
- Publisher access. Several of the sources below were read from PubMed-hosted abstracts fetched via NCBI E-utilities because the publisher full texts were access-walled. Every number attributed to those papers came from the abstract, which carries them.
- A declared conflict on the position stand. Its own disclosure states that one author is the CEO of the ISSN and that the ISSN receives funding from companies that sell, market and manufacture dietary supplements; three authors are affiliated with the UFC Performance Institute. It is also a narrative synthesis, not a systematic review. That does not make it wrong, and it is the best combat-sport-specific document available — but it is why the biopsy measurement, not the stand's restatement of it, is cited for the glycogen ratio here.
Questions fighters ask
How much does bodyweight fluctuate day to day?
The best-measured figure is a standard deviation of 0.53% of body mass for the change between consecutive days, from 9,521 standardised measurements in one healthy, weight-stable man — about 320 g on a 60 kg athlete and about 410 g on an 80 kg athlete. A separate study of 22 elite male field hockey players at a training camp found first-morning body mass varied with a coefficient of variation under 1%. Both cohorts were weight-stable and not cutting, so those numbers are a floor rather than a typical value for a fighter. Someone in a deficit, training twice a day and moving carbohydrate and fluid should expect more variability than that, not less. No measured figure exists for combat athletes in camp.
Should a fighter weigh in every day during camp?
Daily standardised measurement is what makes a readable trend possible, so yes — but with the understanding that the daily number is a data point and not a verdict. In the one athlete camp that tested measurement duration, three days of first-morning measurement carried as much information as six or eight, so the returns come from measuring consistently over more calendar time rather than more often per day. Weighing twice a day adds a second, noisier series rather than sharpening the first. The practical rule that falls out of the arithmetic on this page is: weigh often, conclude rarely.
Is a seven-day moving average the right way to read a weight trend?
Averaging genuinely helps, but the standard claim about how much it helps is overstated by roughly threefold. The square-root-of-seven argument assumes each day's reading is an independent sample of the true value. The measured data says otherwise: variability in body mass change grows from 0.53% at a one-day interval to 0.69% at seven days, which indicates a drifting baseline rather than independent noise, and averaging does not remove drift. A realistic floor on comparing one week's average against the next is around 0.4 kg on a 60 kg athlete, not the 0.19 kg the naive arithmetic promises. No published study validates any smoothing method on athlete body mass series.
Why did my weight go up during a week of dieting?
On the measured variability figures, a week that goes up is entirely ordinary and carries almost no information. A single hard session moved body mass by more than 1% in 50–85% of players in one training camp, and by more than 2% in up to 40% — larger than a full week of real loss at the 0.5–1 kg per week rate the ISSN position stand describes for combat athletes. Glycogen and its bound water, gut contents and fluid handling each move the scale by amounts in the same range. That is a statement about what the scale is measuring. It is not permission to make up the difference acutely, and any decision to change a camp belongs with the coach and the medical staff, not the Tuesday reading.
How long before a bodyweight trend means anything?
On this article's own arithmetic — no published method exists — a one-day comparison is uninterpretable, because the true daily change at a 0.5–1 kg per week descent is roughly 70–140 g against a day-to-day spread with a standard deviation of about 320 g on a 60 kg athlete. A one-week comparison is readable but marginal, with a signal-to-noise ratio somewhere between about 1.2 and 2.4 once the drifting baseline is accounted for. A two-week comparison is the first that is comfortably readable, and a four-week window is unambiguous. That is why decisions about whether a camp is on track are two-to-four-week decisions.
How much water does glycogen carry?
Muscle biopsy work in nine aerobically trained subjects, dehydrated by 4.6% of body mass through cycling in the heat, measured a recovery ratio of 3 g of water stored per gram of glycogen under limited rehydration — and 1:17 when fluid was fully replaced to match losses, which the authors attributed to water storage not bound to glycogen. The 2025 ISSN position stand restates the relationship narratively as 1 g of glycogen to 2.7 g of water. Both conditions matter: the 1:3 figure is a recovery ratio measured under insufficient rehydration in a small non-combat cohort, and it should not be extrapolated to whole-body kilograms without saying so.
Does the menstrual cycle change bodyweight?
The two available studies report a change in body mass across the cycle but disagree about direction, and neither reports a magnitude in kilograms. One found body mass higher in the mid-luteal phase than the mid-follicular in 30 recreationally active young women, with total body water and fat mass similar between phases and large individual variability. The other found body mass and total body water peaking in the early follicular phase in 20 elite female soccer players tracked across two cycles. Neither cohort was a combat athlete and neither was in a deficit. The defensible practical point from the first study's own authors is to repeat body composition measurements in the same phase rather than to apply any correction — no figure exists to correct with.
Can you tell fat loss from water loss on a scale?
No. A body mass reading is one number covering fat mass, lean tissue, body water and gut contents, and only the first two move slowly. The compartments that move fastest are the ones a camp is not trying to change. In one camp study, post-match body mass changes were unrelated to the following morning's urine specific gravity, which means an athlete cannot even use the next day's reading to infer whether they are carrying a hydration deficit. Separating compartments requires a different measurement entirely, and those methods have their own errors — dehydration alone is enough to make a body composition scan misreport water as lost lean tissue.
What weekly rate of weight loss does the research recommend for fighters?
The 2025 ISSN position stand states that combat athletes are commonly recommended to aim for weight loss of 0.5–1 kg of body mass each week, described as contingent upon the length of the camp and how much body mass must be lost. Two conditions travel with that. It is a narrative recommendation inside a position stand with no evidence grade attached, framed around professional MMA; and the same document sets macronutrient floors during a longitudinal descent — carbohydrate 3.0–4.0 g/kg, protein 1.2–2.0 g/kg and fat 0.5–1.0 g/kg/day — below which the descent it describes is no longer the descent being studied.
How far above their division should a fighter walk around?
The position stand puts the off-camp and general-preparation figure at 12% to 15% above the weight division requirement. For a 56.7 kg division that is roughly 63.5 to 65.2 kg. It is the most consequential number in the document because every later figure assumes it: an athlete living far outside that band has not merely made the camp harder, they have moved outside the conditions under which the rest of the guidance was described. It is also professional MMA framing with no evidence grade attached, and it says nothing about what any individual athlete's healthy walking-around weight is.
How much weight do fighters regain after a weigh-in?
It depends entirely on the weigh-in format, and the two best datasets sit at opposite ends of it. In 399 male professional boxers weighing in the day before under California commission scale data, 389 (97.5%) gained weight before competition, with a mean gain of 4.4 ± 2.2 kg or 7.2 ± 3.5% of body mass, and 20.6% gaining 10% or more. In 31 supervised professional MMA athletes weighing in eight days out — an unusually long window — mean regain was 7.5 kg (11.2%) within 30 hours. At a same-day weigh-in there is no meaningful recovery window at all, and neither figure describes anything.
Do the 6.7%, 5.7% and 4.4% figures add up to a total cut?
No, and reading them that way is a fabrication. The position stand's sentence is "suitable losses in body mass range from 6.7% at 72 h, 5.7% at 48 h, and 4.4% at 24 h, prior to weigh-in" — three answers to one question asked at three moments, not three stages of a plan. Summing them produces a figure near 17% that appears nowhere in the literature and describes nothing. Note also the direction: the figure falls as the weigh-in approaches, because what constrains it is the recovery time available on the other side.
Does a good bodyweight trend mean the cut is going well?
No, and the clearest evidence is a published case study in which an elite male MMA athlete lost 18.1% of body mass across eight monitored weeks — 80.2 kg to 65.7 kg — and finished with a resting metabolic rate 331 kcal lower, testosterone below 3 nmol/L, plasma sodium at 148 mmol/L and serum creatinine at 177 µmol/L, which is acute kidney injury. Week to week on a scale, that looked like a camp on schedule. A body mass series has no channel for kidney function, sodium, hormones or metabolic rate. The scale measures one number, and the things that matter most about a cut are not in it.
What is the noise floor for a fighter specifically?
Nobody has measured it. The two figures used on this page come from a healthy non-athlete measured over 9,521 days and from 22 elite male field hockey players in a training camp who were not making weight. Neither is a combat athlete, neither was in an energy deficit, and neither was manipulating carbohydrate or fluid. Every mechanism that adds variance to a body mass series was absent or reduced in both cohorts, so the honest reading is that they establish a floor of roughly 0.4 to 0.8 kg on a 60–80 kg athlete, and that a fighter in camp should expect more. Filling that gap with a confident number would be inventing one.
Sources
Sourced to
- International society of sports nutrition position stand: nutrition and weight cut strategies for mixed martial arts and other combat sports — Ricci AA, Evans C, Stull C, et al., Journal of the International Society of Sports Nutrition, 2025;22(1):2467909. DOI 10.1080/15502783.2025.2467909, PMID 40059405
- Day-to-day variability in euvolemic body mass — Schneditz D, Hofmann P, Krenn S, Waller M, Mussnig S, Hecking M, Renal Failure, 2023;45(2):2273421. DOI 10.1080/0886022X.2023.2273421, PMID 37955103
- Variability of Body Mass and Urine Specific Gravity in Elite Male Field Hockey Players During a Pre-Olympic Training Camp — Vescovi JD, Watson G, International Journal of Sport Nutrition and Exercise Metabolism, 2019;29(1):46–50. DOI 10.1123/ijsnem.2018-0121, PMID 29893591
- Relationship between muscle water and glycogen recovery after prolonged exercise in the heat in humans — Fernández-Elías VE, Ortega JF, Nelson RK, Mora-Rodriguez R, European Journal of Applied Physiology, 2015;115(9):1919–26. DOI 10.1007/s00421-015-3175-z, PMID 25911631
- An alternative structured weight management protocol to rapid weight loss in mixed martial arts — Maurício CA, Artioli GG, Gonçalves AF, et al., Frontiers in Nutrition, 2025;12:1581698. DOI 10.3389/fnut.2025.1581698, PMID 41132567
- Rapid weight gain following weight cutting in male professional boxers — Murugappan KR, Reale R, Baribeau V, O'Gara BP, Mueller A, Sarge T, The Physician and Sportsmedicine, 2022;50(6):494–500. DOI 10.1080/00913847.2021.1960780, PMID 34310264
- The Effect of Water Loading on Acute Weight Loss Following Fluid Restriction in Combat Sports Athletes — Reale R, Slater G, Cox GR, Dunican IC, Burke LM, International Journal of Sport Nutrition and Exercise Metabolism, 2018;28(6):565–573. DOI 10.1123/ijsnem.2017-0183, PMID 29182412
- Case Study: Extreme Weight Making Causes Relative Energy Deficiency, Dehydration, and Acute Kidney Injury in a Male Mixed Martial Arts Athlete — Kasper AM, Crighton B, Langan-Evans C, Riley P, Sharma A, Close GL, Morton JP, International Journal of Sport Nutrition and Exercise Metabolism, 2019;29(3):331–338. DOI 10.1123/ijsnem.2018-0029, PMID 29989458
- Individualised dietary strategies for Olympic combat sports: Acute weight loss, recovery and competition nutrition — Reale R, Slater G, Burke LM, European Journal of Sport Science, 2017;17(6):727–740. DOI 10.1080/17461391.2017.1297489, PMID 28316263
- Acute-Weight-Loss Strategies for Combat Sports and Applications to Olympic Success — Reale R, Slater G, Burke LM, International Journal of Sports Physiology and Performance, 2017;12(2):142–151. DOI 10.1123/ijspp.2016-0211, PMID 27347784
- Weight Management Practices of Australian Olympic Combat Sport Athletes — Reale R, Slater G, Burke LM, International Journal of Sports Physiology and Performance, 2018;13(4):459–466. DOI 10.1123/ijspp.2016-0553, PMID 28872383
- Weight loss practices in Chinese national and international-level Sanda athletes — Zhong Y, Tang W, Gee TI, et al., Journal of the International Society of Sports Nutrition, 2025;22(1):2551216. DOI 10.1080/15502783.2025.2551216, PMID 40876444
- Whole and segmental body composition changes during mid-follicular and mid-luteal phases of the menstrual cycle in recreationally active young women — Koşar ŞN, Güzel Y, Köse MG, Kin İşler A, Hazır T, Annals of Human Biology, 2022;49(2):124–132. DOI 10.1080/03014460.2022.2088857, PMID 35696275
- The Influence of Menstrual Cycle on Bioimpedance Vector Patterns, Performance, and Flexibility in Elite Soccer Players — Campa F, Levi Micheli M, Pompignoli M, et al., International Journal of Sports Physiology and Performance, 2022;17(1):58–66. DOI 10.1123/ijspp.2021-0135, PMID 34404026
- Validity of the current NCAA minimum weight protocol: a brief review — Loenneke JP, Wilson JM, Barnes JT, Pujol TJ, Annals of Nutrition and Metabolism, 2011;58(3):245–9. DOI 10.1159/000330574, PMID 21846975
Read next
Plan the descent, don't guess it
Fighter Cut builds a week-by-week plan from today to your weigh-in, classifies the rate you are actually losing at, and logs what you eat against it. It does not make a cut safe — nothing does. It makes the numbers visible early enough to change them.
Open Fighter Cut